Leading Expertise
in Desktop and Embedded Software
From Operating Systems to GUI frameworks. From troubleshooting to complete project development. Get the software expertise you require to succeed.
Solutions that Make a Difference
For over 25 years, customers from various industries trust KDAB with delivering unique, high-quality cross-platform desktop and embedded software solutions based on deep expertise in Qt, C++, Rust, and 3D technologies.
Your Success is our Priority
KDAB provides expert advice, development and training tailored to your needs at any time in your development cycle, from technology selection and architecture, through all aspects of application development to deployment, CI and maintenance.
Stay Informed and Inspired
As a software developer, you are undoubtedly keen to remain curious and up-to-date. KDAB supports your growth by sharing useful insights through blogs, videos, publications, and events, along with valuable open-source tools to boost productivity.
What's new?
Slide to get a glance at the latest events, publications and other activities by KDAB and our Partners.


Mastering Software Technology
across the Stack
In thousands of software projects of all kinds and sizes the KDAB engineering team has gathered a unique, collective knowledge in all aspects of desktop and embedded software and beyond.
Leading Qt Expertise
Since 1999, KDAB has been the largest independent Qt consultancy worldwide and today is a Qt Platinum partner. Our experts can help you with any aspect of software development with Qt and QML.
Deep understanding of Modern C++
C++ can bring advantages and challenges to your project both at the same time. The team at KDAB is here to help you elevate your C++ application to the next level.

Integration of Rust
KDAB can guide you incorporating Rust into your project, from an overlapping element to your existing C++ codebase to a complete replacement of your legacy code.

Desktop and Embedded platforms
Whether you are using Linux, Windows, MacOS, Android, iOS or real-time OS, KDAB helps you create performance optimized applications on your preferred platform.

Slint - GUI toolkit
If you are planning to create projects with Slint, a lightweight alternative to standard GUI frameworks especially on low-end hardware, you can rely on the expertise of KDAB being one of the earliest adopters and official service partner of Slint.
Cutting-edge 3D/XR
Incorporating 3D into 2D UIs or creating compelling XR experiences can be challenging. The 3D experts at KDAB bring incisive know-how to your project.

Flutter for Embedded and Desktop
Deep expertise in embedded and desktop software, coupled with Flutter proficiency allows KDAB to provide comprehensive support throughout the software development lifecycle.
“They (KDAB) felt just like part of the team and channeled their substantial expertise into a very collaborative process.”
Kevin Spannaus, Project Manager
Braumeister
Trusted by the best
in their business
Hundreds of customers have relied on KDAB in the past decades to bring their vision to life.

Empowering Engineers at Siemens Energy
Siemens Energy revolutionized their engineering process by developing the Plant Asset Manager (PAM). With the help of KDAB, PAM became a centralized, scalable platform empowering engineers to deliver reliable energy worldwide. Read more about this project.
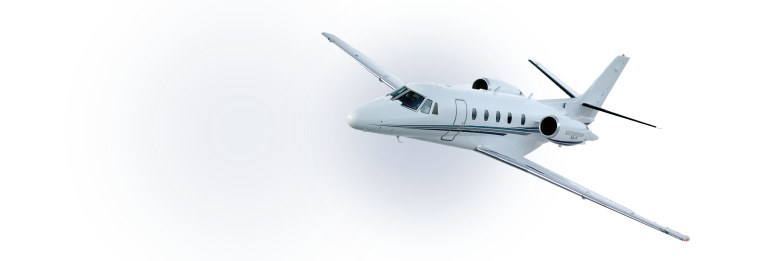
Re-Engineering »nice« for Lufthansa Technik
As a provider of cabin management and in-flight entertainment system »nice«, designed for VIP and business aircraft like Bombardier, Lufthansa Technik faced the resource-intensive challenge of maintaining multiple native applications for its user interfaces. Read how KDAB improved the system using Qt.
NVIDIA and KDDockWidgets
NVIDIA, needed to enhance the user experience of their developer tools. The existing window management system was limiting the user experience, especially as the complexity and number of tools increased. KDAB brought a solution to this challenge.
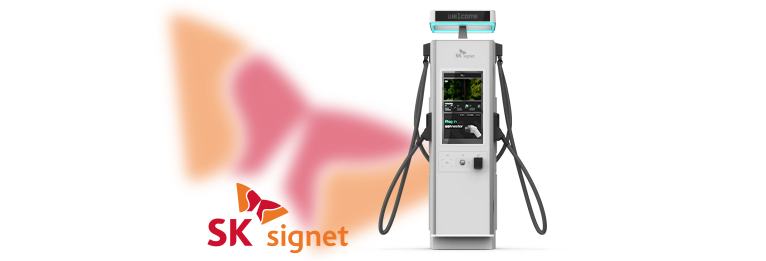
EV Charger Interface for SK Signet
SK Signet, leading provider of Electric Vehicle charging solutions, needed to upgrade the UI for their chargers. The existing solution, had technical debt and outdated features. KDAB and tQCS helped port the solution from Qt to Slint.

Lighting the Path of Cardiac Surgeries
LUMA Vision is developing a technology that visualises the interior of the heart, providing doctors with clear and critically, precise navigation. Learn how the needs of both 2D and 3D imaging in this project were addressed, using Qt in combination with Vulkan for fluent 3D rendering.

Engineering the Passenger Experience in Level 4 AVs
KDAB helped MOTOR Ai, a Berlin-based autonomous driving pioneer, build a scalable, calming Human-Machine Interface (HMI) for the future of mobility.

More customer showcases from various industries
“We strive to continually improve our development practices and processes to ensure they consistently meet or exceed our customers’ requirements.”
Matthias Kalle Dalheimer
President and CEO of KDAB
KDAB is committed to developing high-quality and high-performance software, and helping other developers deliver to the same high standards. We create software with pride to improve your engineering and your business, making your products more resilient and maintainable with better performance.
Learn more about KDAB as a company and understand why we are considered a trusted partner by many.